Discussion of Similarity Metrics
Euclidean Distance
Analysis
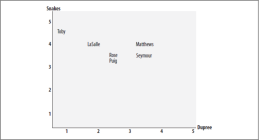
The simplest method of calculating a similarity is to use the Euclidean distance, where the axes on such graph would be the common attributes of the data objects. The data objects that are charted in the resulting graph is said to be charted in the preference space.
Figure 1. A chart of Euclidean distance. In this example, the axes contain movies that the data objects (in this case, movie critics) are charted against.
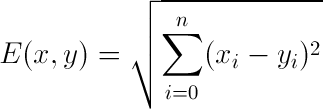
In order to calculate the similarity between two data objects, the sum of all differences (between of each attribute of the data objects) is squared, or mathematically:

Figure 2. E(x,y) is the Euclidean Distance of two objects (x, y) and i is the current attribute. In order for the function to return a higher value for similairty, 1/[1+ E(x,y] is used instead.
A drawback to this chart is that the two dimensional nature of the Euclidean distance limits the ammount of data available to be illustrated.
Python Implementation
# Inputs: Given a list of all objects, specify which two objects whose
             similarities will be calculated
# Output: Value between 0, and 1, where 1 means that the objects are identical

def euclidean_distance(list, object1, object2):
    sum_of_squares = 0.0

    # Sum the squared differences over all objects
    for i in range(len(object1)):
      sum_of_squares += (object1[i] - object2[i])**2

    # square root of answer
    # return (sum_of_squares**0.5)

    # or to get higher similarity = higher score:
    return (1/(1 + sum_of_squares**0.5))
References
The previous content is based on Chapter 2 of the following book:Segaran, Toby. Programming Collective Intelligence: Building Smart Web 2.0 Applications. Sebastopol, CA: O'Reilly Media, 2007.