Applied Theory & Practice I
Preliminary Mining on Cabspotting GPS Trace
In this project, I am working on a GPS trace dataset in Weka. My goal is to explore some interesting geographical information on this dataset, and the mining strategy I use is DBSCAN clustering. In the future work, I will combine the GPS trace with the corresponding occupancy information to further mining some social information, and the strategy would be Bayesian based classification.
#----------------------------------------------------------Project Document----------------------------------------------------------#
1 Dataset Declaration & Documentation
The Cabspotting Dataset contains GPS coordinates and timestamps of 536 taxicabs in the San Francisco area, spans 20 days: from May 20, 2008 until June 7, 2008.
There are 536 txt files in this dataset, each has about 20000 lines. And the format of each line is numeric data [latitude, longitude, occupancy, time], e.g.: [37.75134 -122.39488 0 1213084687], where latitude and longitude are in decimal degrees, occupancy shows if a cab has a fare (1 = occupied, 0 = free), and time is in UNIX epoch format.
There are some simple ideas I came out with these data: i. Use each single file, I can get a route of a single taxicab in 20 days. ii. Use all these files, but use data with the same timing, I can get a network topology of these taxicabs. iii. I can get the waypoints where the passengers get on/off the taxicabs using the occupancy values in the logs. iv. Based on the time varying network topology and waypoints, I may make some prediction or recommendation.
2 Project Goal & Toolkit Declaration
Using the Cabspotting Dataset, I will do the following things:
i. Find mobility pattern of a single taxicab, such as its high probability regions.
ii. Find time varing mobility patterns of multiple taxicabs, such as the regions of interests, and the schedule similarities between taxicabs.
iii. Caluculate some probabilities and then make some predictions or recomendations.
I choose Weka as the data mining toolkit, because my dataset is simple enough to get working in it, and also there are lots of documents for studying Weka.
3 Data Exploration
The GPS data I'm going to explore contains two aspects: i. Select some taxicabs, to explore daily mobility to each of them. ii. Select some time slices, to explore the entire mobility (network topology) of all taxicabs.
A lot of statistics to do with the time slices, and regions calculation. First, I did some simple statistics on single taxicabs. For example, the visulizations of a single taxicab routes in one day and the whole 20 days are as followed:
i. One day's route
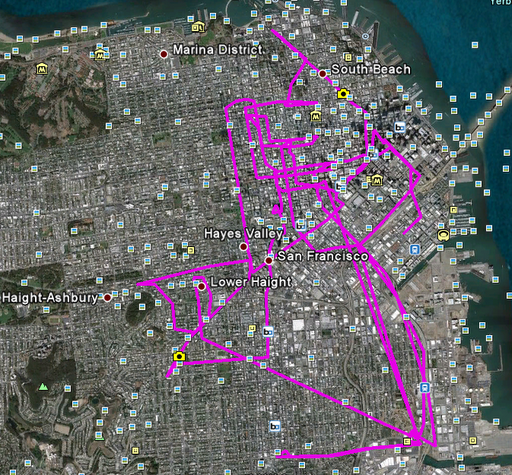
blank line
ii. 20 day's route
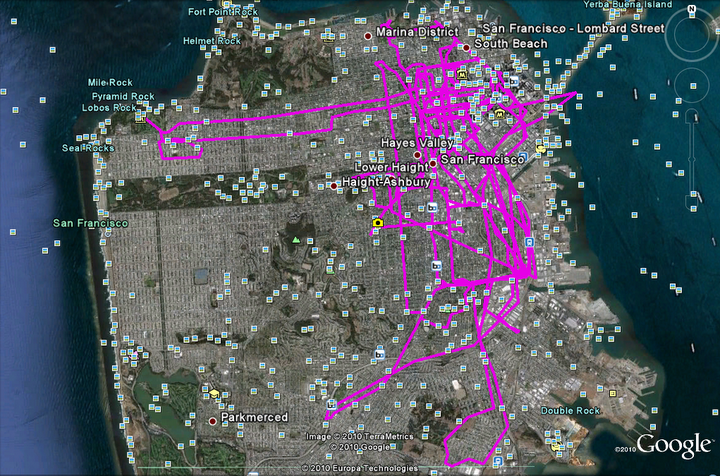
blank line
The visualizations of two taxicab routes in the whole 20 days (without preprocessing) look very similar. I do need to make the route more clear to show the time flows and overlaped parts.
4 Data Preprocessing
i. All the txt files in the dataset can be easily convert to csv files, to process in WEKA.
ii. Each original file in my dataset is a 20 day's GPS log, but the time intervals between each two records are not identical. So for each file, I need to select some pieces of time (one day, 10 hours' daytime, night time, etc), so that I can generate meaningful subsets of the GPS logs.
iii. Since each file represent a GPS log of a single taxicab, the time stamps and time intervals are not the same among those files. So I need to process multiple files with selected identical time.
5 Dataset Parsing & Tool Input
The dataset is now readable by WEKA.
i. I wrote a shell script to convert the 536 txt files in my dataset to csv files, and also a shell script to load each txt file into a table in a mysql database. So the database working in weka contains 536 tables. Each table has 4 attributes: latitude, longitude, occupy, time. Since the value of time in each table is unique, so it is easy to get the records by query the time.
ii. I wrote another shell script to create a mysql database, and load all files into a single table, in which an extra attribute taxi="filename" is added. So the database working in weka contains records of all the files, and can be selected by the attribute "taxi". The table looks like:
  latitude, longitude, occupy, time, taxi
  37.75134, -122.39488, 0, 1213084687, abboip
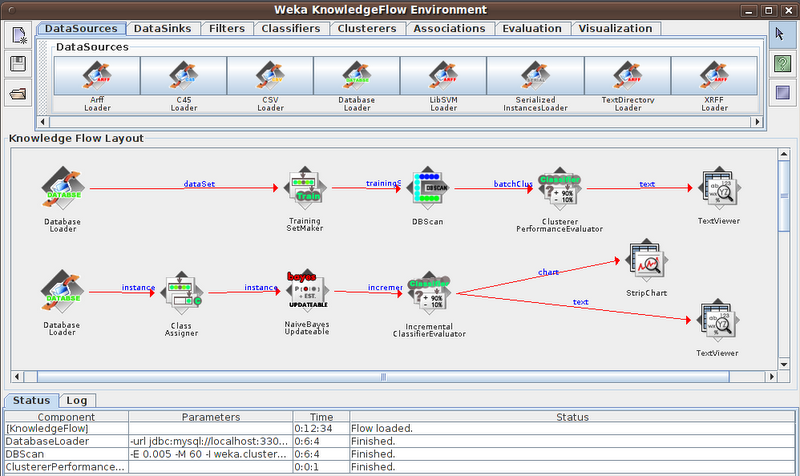
6 Data Mining Flow
I plan to apply clustering and classification on my data set.
7 Preliminary Results
In the above flow chart, the first flow is clustering, I load data from mysql database, and choose DBSCAN to cluster the geographic data points (to classify high density regions). Through some experimental study, I find a set of DBSCAN parameters best fit the dataset. That's: epsilon=0.005, minPoints=60. I applied the flow to single taxi logs, the following is one of the results. Of course, I also need to do clustering on multiple taxi logs and try to find some pattern. The second flow is for classification, I will move on to this step in the next project.
    Clustered DataObjects: 21962
    Number of attributes: 2
    Epsilon: 0.005; minPoints: 60
    Index: weka.clusterers.forOPTICSAndDBScan.Databases.SequentialDatabase
    Distance-type: weka.clusterers.forOPTICSAndDBScan.DataObjects.EuclidianDataObject
    Number of generated clusters: 8
    Elapsed time: 363.5

    Clustered Instances

    0       2005 ( 11%)
    1      14949 ( 80%)
    2        227 (  1%)
    3       1101 (  6%)
    4        117 (  1%)
    5        189 (  1%)
    6         39 (  0%)
    7         61 (  0%)

    Unclustered instances : 3274
8 Next Actions
i. My next step is to apply DBSCAN to different subsets (e.g., specific time range, specific status-occupied or empty, etc.) of the whole dataset, to find patterns in different aspects and density based classifications.
ii. Calculate some probabilities (e.g., the probability of occupied taxi under high density regions, the probability of occupied taxi under certain time range and also high density regions, etc.) using the clustering results, and may apply them to train a Bayesian based classifier. Then use some data as test set to evaluate it.
#----------------------------------------------------------Project Summary-----------------------------------------------------------#
I obtained some useful experience from data preprocessing, such as writing scripts to import the large dataset to a database, how to connect mysql with Weka, and how to use the database in Weka. However, I did not have much time to mining more useful information from the dataset in this project, I will continue the work on the same dataset in the next project.