Mining for Groups Using Clustering Algorithms
How do we express groups of similar data objects in a machine?
If we have a data set that contains many items that are similar, one way to represent groups of similar items is to apply clustering algorithms to the set. A clustering algorithm will use similarity metrics to evaluate how similar data objects are. Once these similarity scores are procured, they can be used to place the objects in groups. Groups, or clusters, of similar objects can then be visualized through scatter plots, dendrograms, or by other means.
Hierarchical Clustering

The hierarchical clustering algorithm consists of two different flavors: agglomerative clustering and divisive clustering.
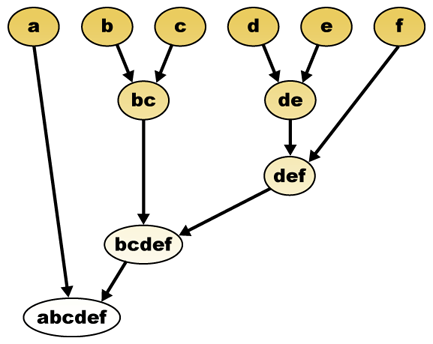
Both of these techniques involve building some type of dendrogram or tree that reveals the relationships between the data
objects in a data set (see the image above). Agglomerative clustering begins with each data object being its own cluster.
The next step is to identify which clusters are the closest to others using a distance metric. The similar objects are then
formed into bigger clusters of objects. Each iteration of this approach creates bigger and bigger clusters at each level until
one giant cluster of all the objects remains. Each level of clusters can then be analyzed to determine the groups of similar
data objects that formed. Divisive clustering is just the opposite of hierarchical in that it starts with one giant cluster
containing all data objects, and then divides into smaller clusters after each iteration. It ends when each data object is
its own cluster.
K-Means Clustering

K-Means clustering is also an iterative clustering procedure, but it predefines the number of clusters that will be in your
dataset. The algorithm begins by defining "centroids", which are points that will eventually migrate to the center of each
cluster. The number of centroids chosen therefore determines the number of clusters in the dataset. The centroids are placed
at random spots in the dataset. We then choose a distance metric to determine how far away each centroid is from each of the
data objects. The distances of the objects that are closest to each of the centroids are then averaged, and the centroid is
then moved to the center of the respective data objects. The process is then repeated by finding new distances from each of
data objects to the centroids. The algorithm ends when the centroids no longer move within a certain threshold of distance.
The closest data objects to each of the centroids are the resultant clusters. This process is similar to hierarchical in that
it uses a distance metric to form clusters. It is different in that the number of clusters for k-means is predefined, where
as hierarchical clustering creates levels of clusters.
Heirarchical Implementation
The following code is the python implementation of a hierarchical clustering algorithm. The algorithm takes in a similarity metric and uses it to find similar objects in a vector.
  # This function performs the hierarchical algorithm for clustering the sets of data
  def hcluster(rows,distance=pearson):
  distances={}
  current_cluster_id=-1

  # Each cluster is a row of data
  cluster=[bicluster(rows[i],id=i) for i in range(len(rows))]

  while len(cluster)>1:
    lowestpair=(0,1)
    closest=distance(cluster[0].vec,cluster[1].vec)

    # loop through each cluster looking for the smallest distance between each
    for i in range(len(cluster)):
      for j in range(i+1,len(cluster)):

        # the 'distances' array holds the result of the distance metric calculation between each cluster
        if (cluster[i].id,cluster[j].id) not in distances:
          distances[(cluster[i].id,cluster[j].id)]=distance(cluster[i].vec,cluster[j].vec)

        dist=distances[(cluster[i].id,cluster[j].id)]

        # Find the closest pairs of clusters
        if dist greater than closest:
          closest=dist
          lowestpair=(i,j)

    # Calculate the average distance between the two clusters
    merge_vector=[
    (cluster[lowestpair[0]].vec[i]+cluster[lowestpair[1]].vec[i])/2.0
    for i in range(len(cluster[0].vec))]

    # Create a new cluster from the two closest clusters using the average distance (merge_vector)
    new_cluster=bicluster(merge_vector,left=cluster[lowestpair[0]],
                         right=cluster[lowestpair[1]],
                         distance=closest,id=current_cluster_id)

    # Set the cluster id to negative for clusters not contained in the original set
    current_cluster_id-=1

    del cluster[lowestpair[1]]
    del cluster[lowestpair[0]]
    cluster.append(new_cluster)

  return cluster[0]
K-Means Implementation
The following python code implements the K-Means clustering algorithm. It also has a similarity metric as an argument.
  # This function implements the K-Means clustering algorithm
  def kcluster(rows,distance=pearson,k=4):

  # For each point, find the minimum and maximum values
  ranges=[(min([row[i] for row in rows]),max([row[i] for row in rows]))
  for i in range(len(rows[0]))]

  # Create and randomly place the centroids for a defined k
  clusters=[[random.random()*(ranges[i][1]-ranges[i][0])+ranges[i][0]
  for i in range(len(rows[0]))] for j in range(k)]

  lastmatches=None
  for t in range(100):
    print 'Iteration %d' % t
    bestmatches=[[] for i in range(k)]

    # Determine the closest centroid to each row of data
    for j in range(len(rows)):
      row=rows[j]
      bestmatch=0
      for i in range(k):
        d=distance(clusters[i],row)
        if d lessthan distance(clusters[bestmatch],row): bestmatch=i
      bestmatches[bestmatch].append(j)

    # End the loop when all rows have located the best centroids and the cycle produces the same result as last time
    if bestmatches==lastmatches: break
    lastmatches=bestmatches

    # Relocate the centroid to the average distance of its matching rows
    for i in range(k):
      averages=[0.0]*len(rows[0])
      if len(bestmatches[i]) greaterthan 0:
        for rowid in bestmatches[i]:
          for m in range(len(rows[rowid])):
            averages[m]+=rows[rowid][m]
        for j in range(len(averages)):
          averages[j]/=len(bestmatches[i])
        clusters[i]=averages

  return bestmatches
NOTE: The python code was obtained from the book Collective Intelligence written by Toby Segaran. The images were pulled from Wikipedia.