Last.fm - Top Tracks Around the World
Last.fm is a music service that aggregates its user's listening habits across a variety of media platforms. They provide data in a variety of formats including CSV files, ATOM feeds, and through an API. They have amassed a large database of Artists, Albums, Tracks, and Tags which are all accessible on a per-country basis. I have chosen to focus on the top 50 tracks for every country which Last.fm publishes weekly. This project combines this data with each track's most popular tags with hopes of discovering patterns across countries.
Tool Chain
Data was collected from Last.fm by downloading each country's top tracks CSV file and querying the API for Tag information. The API was queried with the help of LastFmLib.NET. A list of countries was obtained from the ISO 3166-1 standard and then cleaned to work with Last.fm. Both of these tasks were automated with the help of a C♯ application that downloaded the files and called the API. Results were inserted in a MySQL database and then analyzed with KNIME.

Mining
Preprocessing
After aggregating Countries, Top Tracks for each Country, Track Artists, and Track Tags, I generated a dictionary with an entry for each country. Each entry's value consisted of another dictionary that had a value for every "important" tag (important tags were generated from Last.fm's tag.topTags API call with manual filtering). The value for each entry was an aggregate weight for every track that appeared on that country's top 50 list in any week. They were weighted by track position (#1 was weighted more than #50) as well as by the track's tag count (a track that was heavily tagged with that tag was weighted more than if it was rarely tagged with it). These values were then normalized per country to fall between the range 0-100.
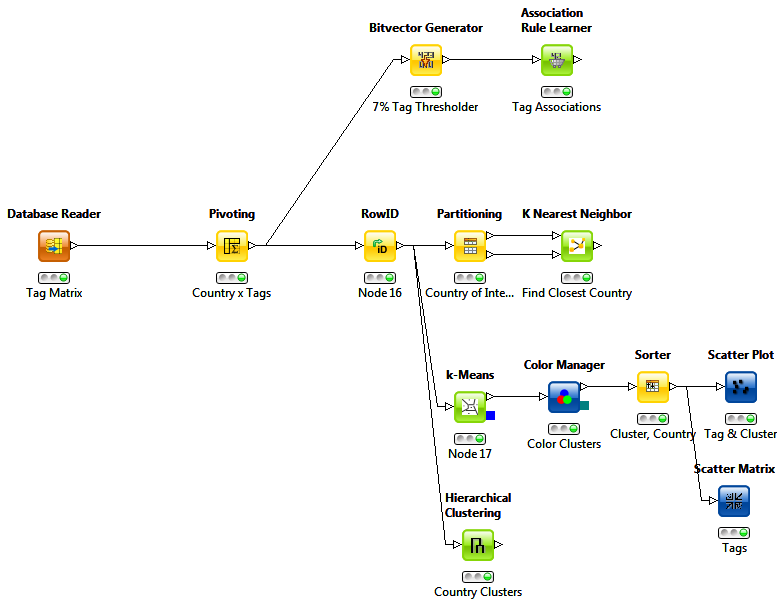
KNIME
Once in KNIME, several facets were explored. Before mining began, the data needed to be transformed using a pivot table into a matrix of Country×Tag.
The upper branch was used to discover tags that were associated with one another. First, each country's tag values were converted to binary values of
"has" and "doesn't have" by using a threshold of 7 out of 100. Then an association analysis was run on the resulting binary data. The
results are below. These rules mainly indicated tags that were closely related and should potentially be merged (this is a universal issue with music
genres -- there are no clear lines). For example, if a country has "pop" and "alternative rock", there's a 97% chance that it has "electronic" with a support of 92%.

The second branch uses k-Nearest-Neighbors to find the country that is most like another. For example, The United States is most like Australia. I have yet to find an elegant way in KNIME to automatically generate this similarity for every pair of countries but the loop construct covers most of them (on average).
The last branch creates clusters of countries which answers my main question from the beginning of the project. The hierarchical one is especially useful in this regard. It shows major divisions among countries at many different levels.
Problems
Last.fm Data Quality
There were several issues with the raw data itself. First, they decided to use CSV files to deliver weekly top tracks instead of TSV. Artist and track names tend to have commas in them but the commas weren't escaped. This made it impossible to correctly parse the records when there were extra commas. I decided to consistently parse each record as if all extra commas belong to the Track name as that seemed most common.
Second, to retrieve the CSV files, the documentation said to use a specific URL format that includes the country's name as defined by the ISO standard mentioned above. It turned out that they only partially followed the standard and some manual cleaning was in order. There was still a small subset (about 5) countries that I could never retrieve data for.
Lastly, their tag data has no quality control what-so-ever. There are over 80,000 tags associated with the top tracks over two weeks (9,000 unique tracks). To manage this, I queried the API for the top 200 tags, filtered out ones that were region-specific or uninteresting ("favorites"), and ignored all others in the KNIME workflow.
KNIME and MySQL
Both KNIME and MySQL Workbench (the tool to design the database schema) had stability problems with semi-frequent crashes that sometimes resulted in data loss. Frequent saving mitigated much of the issues associated with this.
KNIME's visualizations aren't very customizable and some visualizations aren't as useful as they could be, The clustering scatter plot is unable to use Country name as an axis which is where the most interesting pattern will be (if cluster group is the other axis). It is still useful to plot cluster group and a particular tag though. The hierarchical cluster dendogram truncates many of the country names; making the graph hard to interpret.
Conclusions
While the mining process with KNIME did expose many interesting patterns, the process was handicapped by incomplete and/or missing mining strategies. Exploring other toolkits like Wekka (whose nodes can be used within KNIME) or writing a custom bit of mining code would be beneficial. This data set could be even more interesting if paired with other country statistics like GDP, life expectancy, dominant religion, geographic location, etc. This will be explored in the next project.