The purpose of this project was to analyze NASCAR race data from the 2008, 2009, and 2010 seasons and to develop a classifier to predict race winners. It was desired to compare the classifications to NASCAR betting odds to see if the market was inefficient and a develop a profitable betting strategy but the historical betting odds were not available for free.
The classifiers tested were all the available classifiers in the Knime toolkit:
Regression Type – Linear regression and Non-linear regression
Classifier Type – Artificial Neural Network, Decision Tree, Support Vector Machine, and Naïve Bayes.
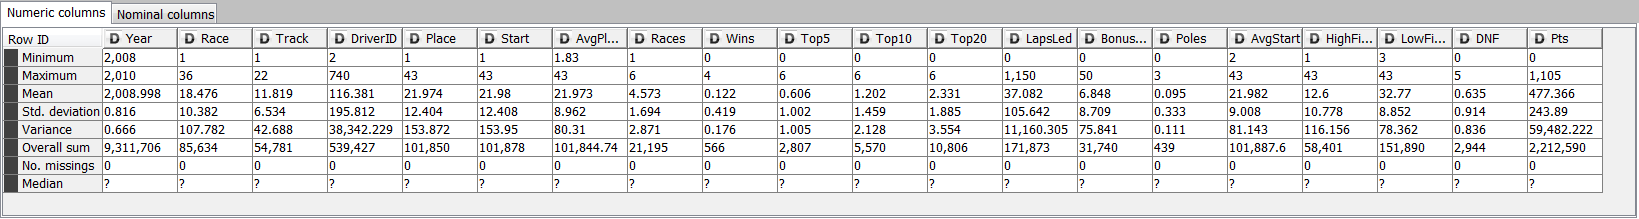
The data set includes the results of the entire 36 race season from 2008 to 2010 and averages for drivers based on track and track type. It was obtained from http://www.driveraverages.com as html files using a wget script. The data included driver statistics such as average start, average finish, wins, top 5's, top 10's, top 20's, pole positions, high finish, low finish, NASCAR Sprint Cup points and NASCAR Sprint Cup bonus points. It also include track types for each race: short track, intermediate track (tri-oval), intermediate track (other), restrictor plate track, flat track, and road course.
The data was obtained in two formats; 1) race results and 2) driver averages. The race results were per driver records with one file per season with 1 file per race for a total of 108 files (3 seasons times 36 races) with a total of 1293 records. The driver data were per driver records with one file per track for a total of 22 files (one file times 22 tracks). The data was extracted from html using Python regular expression scripts. An example of the track extraction script is shown below:
#!/usr/bin/python
import csv, re
filePrefix="race.php%3Fsked_id="
m1=re.compile('(.*?) ',re.DOTALL)
m2=re.compile('(.*?) ')
m3=re.compile('')
m4=re.compile('<a href=\"track.*?id=(\\d+).*\')
for i in range(1, 37):
for j in range(2008, 2011):
infile=filePrefix + str(j) + str(i).zfill(3)
fin=open(infile, "r")
wholeFile = fin.read()
fin.close
track=m4.findall(wholeFile)
records=m1.findall(wholeFile)
for record in records:
stats=m2.findall(record)
driver=m3.search(record)
if (len(stats) != 8):
break
print str(j) + ';' + str(i) + ';' + track[0] + ';' + driver.group(1),
for stat in stats:
print ';' + stat.strip(),
print
The two data sets were fused into a single flat file format using another Python script for importation into Knime.
One work flow was created to analyze and classify the data.
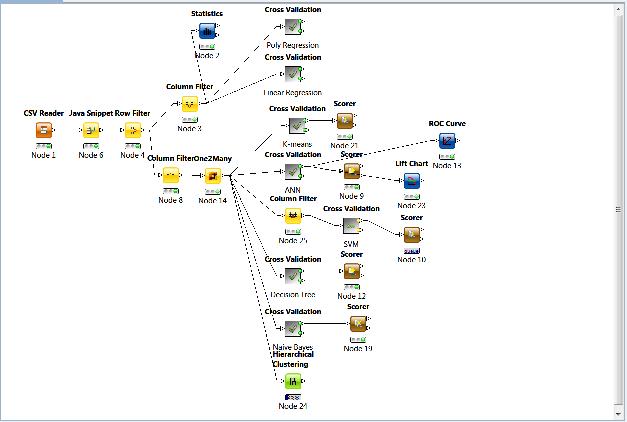
The classifiers were trained and tested using cross-validation with random sampling. Overall, the classifiers returned good results with the best classifier being the Artificial Neural Network that predicted winners for 22 races with a 32% accuracy. This accuracy would result in profitable betting strategies because the payouts are usually greater than 3 to 1. and typically pay greater than 5 to 1.

All of the classifiers tended to error on the side of false negatives and did not predict winners in many races. However, this is a desirable characteristic from a wagering perspective because you do not suffer losses on those races as you would with a false positive.
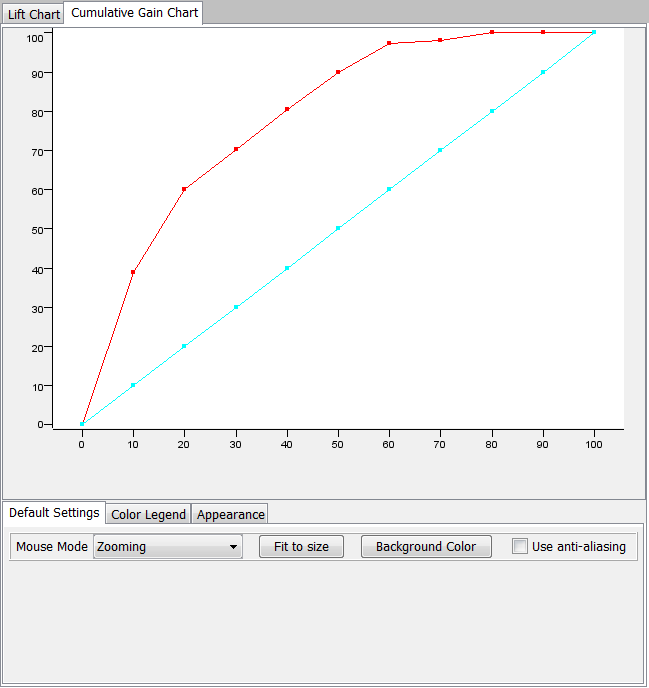
The lift chart below shows the classification has good convexity. I intend to assess the classifier performance against the odds next NASCAR season which starts in February 2011.