Final Project - Skier Data
Exploration of the dataset
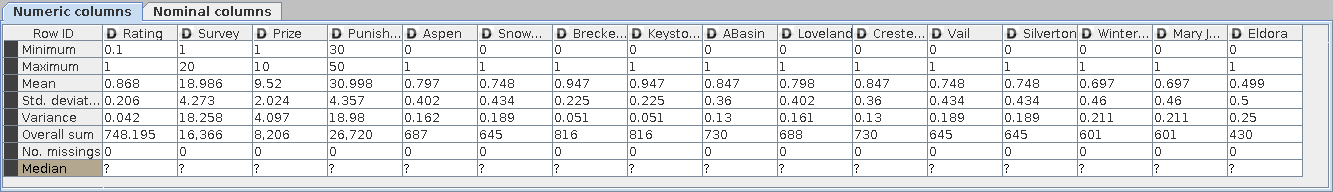
The data set consists of 989 records with 16 data fields. The data appears to be related to the ski industry because of the references to ski resorts. The data fields include Rating, Survey, Prize, Punishment, Aspen, Snowmass, Breckenridge, Jeystone, ABasin, Loveland, CrestedButte, Vail, Silverton, WinterPark, MaryJane, and Eldora. The Rating field is a float with values from 0 to 1. The Survey field is an integer with values of either 1 or 20. The Prize Field is an integer with values of either 1 or 10. The Punishment field is an integer with values of either 30 or 50. The remaining fields are binary, either 0 or 1 for each resort.
Data preprocessing (cleansing, transformation)
There were several anomalies in the data. These include:
- 42 instances of 'Q' found in otherwise binary CrestedButte field. All of the records with a 'Q' in CrestedButte are exactly the same. I remove these records because they appear to be duplicates or mistakes.
- 43 instances of '-1' found in otherwise binary Loveland field. All of the records with a '-1' are exactly the same. I removed these records because they appear to be duplicates or mistakes.
- The 42 records with a rating of 0.675 all have a '?' in the Silverton field and have the rest of their field exactly the same. I removed these records because they appear to be duplicates or mistakes.
Summary statistics
Data Mining
Because the data did not contain clear class labels, I chose to perform k-means clustering, association analysis, and hierarchical clustering. The following tasks were performed:
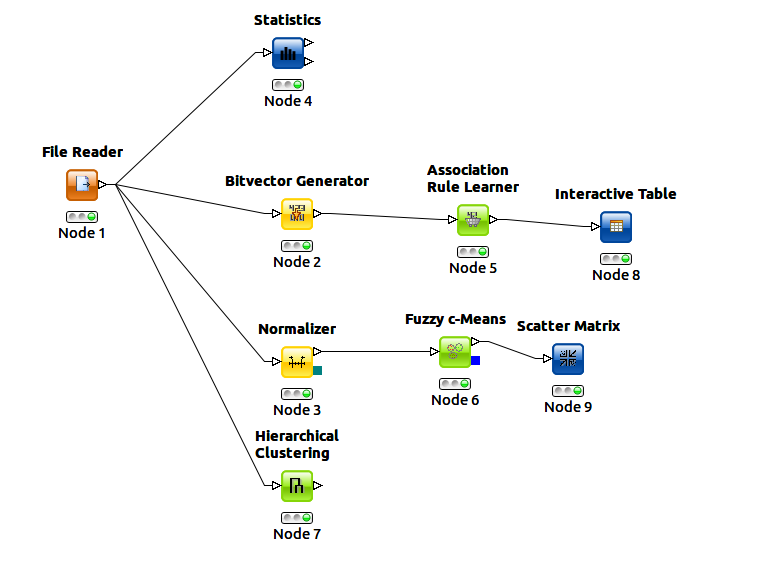
- Statistical analysis in Knime using the standard statistic tool node (workflow shown below)
- Development of a custom K-means clustering implementaion in Python to allow for iteration of different cluster sizes for comparison to residual error. The Knime toolkit would have required setting up an invidual work flow for each variation in cluster quantity. Distance algorithms tried included Minkowski distance for 16 features and Jaccard distance. Cluster sizes from 2 to 30 were tested. (code shown below)
- Association analysis using the knime toolkit (workflow shown below)
- Fuzzy clustering using the knime toolkit for 5 clusters. (workflow shown below)
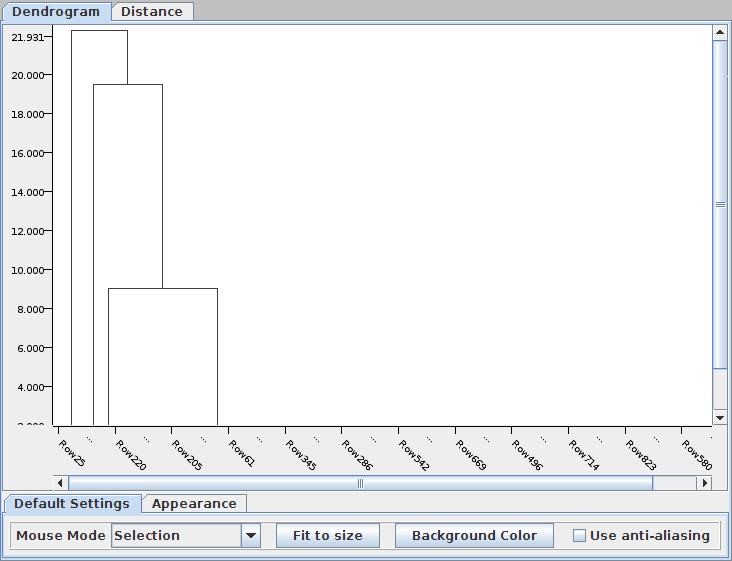
- Hierarchical analysis using the knime toolkit (workflow shown below)
The following is the python implementation of k-means cluster analysis.
#!/usr/bin/python

import random
from math import sqrt,  pow

def kmeans(distance,  numClusters=3,  maxIter=100,  stopCriteria=0.01):
    del centroids[:]
    zeroCentroid=[0.0]*len(fields)

    # initialize the centroids to three random data points
    for i in range(numClusters):
        centroids.append(random.choice (records))

    for i in range(maxIter):
        # loop through records to find closest centroid and assign that record to it
        for record in records:
            for cenIndex,  centroid in enumerate(centroids):
                assignedCentroidIndex=centroid[-1]
                if distance(centroid,  record) < distance(centroids[assignedCentroidIndex], record):
                    record[-1]=cenIndex

        # loop through records to calculate new centroid locations based on revised assignments
        newCentroids=[zeroCentroid]*numClusters
        centroidRecordCount=[0]*numClusters
        for record in records:
            assignedCentroidIndex=record[-1]
            for fieldIndex,  fieldValue in enumerate(record):
                newCentroids[assignedCentroidIndex][fieldIndex] += fieldValue
                centroidRecordCount[assignedCentroidIndex] += 1.0
        for cenIndex,  newCentroid in enumerate(newCentroids):
            for field in newCentroid:
               if (centroidRecordCount[cenIndex] != 0):
                    field = field / centroidRecordCount[cenIndex]
               else:
                    field = 0
        centroidError=0
        for cenIndex,  newCentroid  in enumerate(newCentroids):
            centroidError += rs_error(newCentroid,  centroids[cenIndex])
        if centroidError < stopCriteria:
            break


def totalError(errorFn):
    error=0
    for record in records:
        error += errorFn(centroids[record[-1]],  record)
    return error

def jaccard(dataObject1,  dataObject2):
    currentDistance = 0
    for i in range(len(dataObject1)-1):
        if dataObject1[i] != dataObject2[i]:
            currentDistance += 1
    return currentDistance

def rs_error(dataObject1,  dataObject2):
    error = 0
    for i in range(len(dataObject1)-1):
        error += pow(dataObject1[i] - dataObject2[i], 2)
    return sqrt(error)


infile="final_preprocessed.csv"
#structure to store records
records=[]
centroids=[]

fin=open(infile,  "r")
#names of data fields
fields=fin.readline().split(',')
fields.append("ClusterID")
while 1:
    line = fin.readline().strip()
    if not line:
        break
    record = line.split(',')
    record = map(float,  record)
    # assign record to cluster 0 for now
    record.append(0)
    records.append(record)
fin.close

for i in range(2,  31):
    kmeans(jaccard,  i,  500,  0.01)
    print str(len(centroids)) + ", " + str(totalError(rs_error))
Conclusions
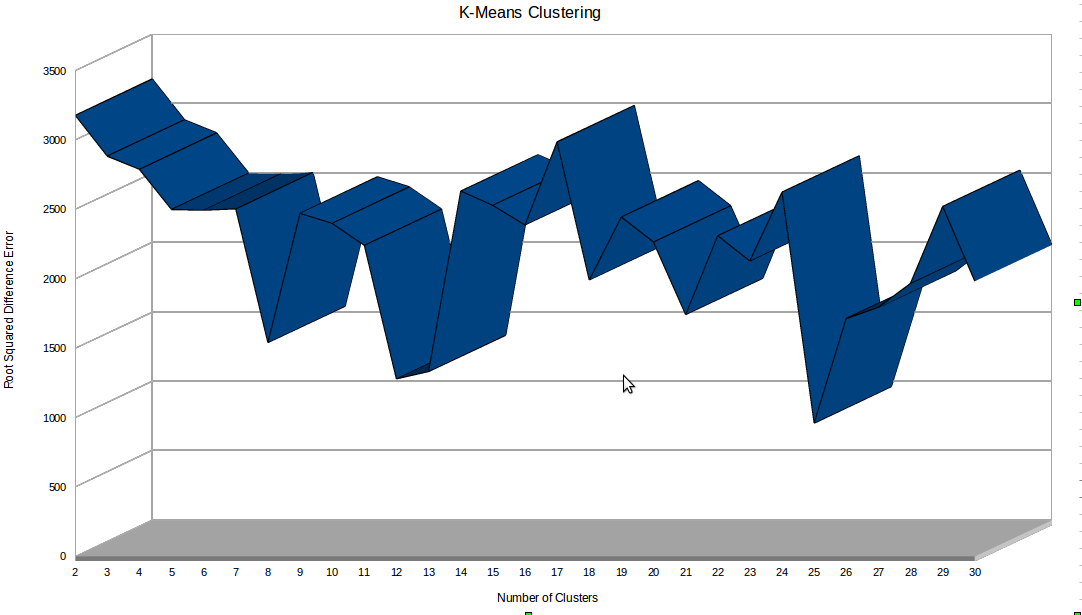
The Minkowski distance in 16 dimensions gave the most consistent clustering results with the least residual error. Cluster quantitiies of 2 to 30 were tested and 25 clusters gave the smallest residual error. The cluster size versus residual error is shown in the figure below:
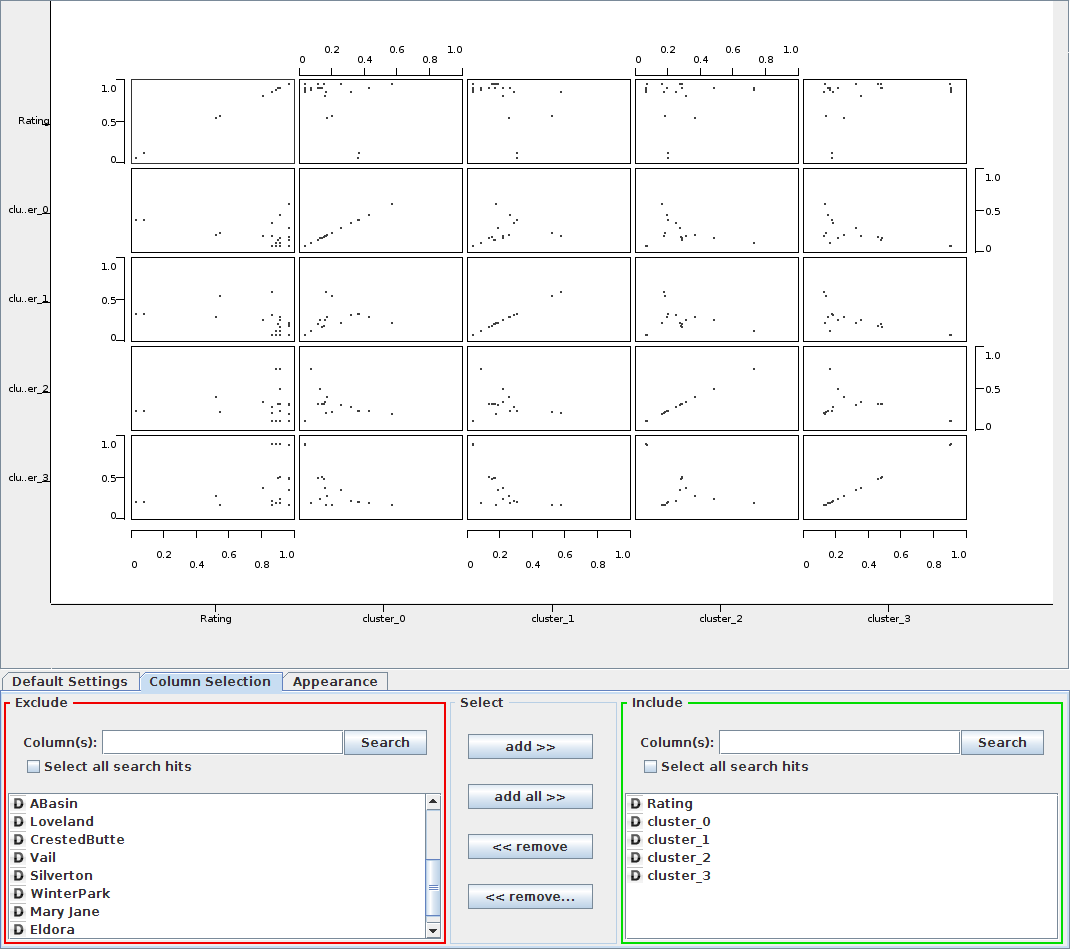
The fuzzy clustering produced are plotted against Rating shows high ratings among all the clusters indicating that the information split must be dependant on other factors such as resort.
The hierarchical clustering in Knime was not very useful. The Segeran implementation produced much better dendro-diagrams.