Data Mining Portfolio
FCC Internet Speeds Data Set
Dataset
The focus of this project is on the consumer broadband test data provided by the FCC. This data was collected by the FCC from users testing their internet connection through the FCC website and is updated on a daily basis. The FCC has provided an API for culling their data that requires passing in the longitude and latitude coordinates of a location with the desired data. Unfortunantly the site did not offer a more intuitive means of gathering data (such as by cities, counties, or zip code) so two opportunities presented itself. The first was to just blindly and randomly pick latitude and longitude coordinates within the borders of the United States. The major disadvantage of this approach is that by justing picking locations randomly, there would be little information about the location that can be linked to the FCC results to be mined. Using this random approach also introduces the possibility of requesting "unintelligent" queries to the FCC site by asking for results in in uninhabited locations like deserts, lakes, oceans, etc. The second alternative that was devised was looking for data of cities with their approximate longitude and latitude coordinates recorded as well. By doing this a latitude and longitude coordinate are given a names that can be used to cull further attributes to be studied.After some digging, I found a data set that contained about 25,000 US locations along with their respective longitude and latitude coordinates. This list allowed for searching for approximatly 25,000 persumably inhabited locations to query data from. However this list only had city and state names as well as the coordinates. In an attempt to find add exra attributes in order to mine I found a census data set that contained population records over the last ten years for approximately 80,000 locations. This data set contained city name, state name, and population data, but it did not contain latitude and longitude coordinates. The final data set used for this study was the overlap between these two location data sets that were then feed into the FCC broadband API.
Selected Attributes from Dataset:
- City Name
- State
- Latitude
- Longitude
- Wireline Max Download
- Wireline Max Upload
- Wireline Average Download
- Wireline Average Upload
- Wireless Max Download
- Wireless Max Upload
- Wireless Average Download
- Wireless Average Upload
- Wireline Tests
- Wireless Tests
- Population 2009
Tools
Once again the primary tools used to explore the data were excel, python, and KNIME. Both excel and python were used primarily for preprocessing while KNIME was used for visualizations and its mining algorithms.
`Goal
The original intent of this exploratory process was to discover what factors correlate to or contribute to the varying broadband performances throughout the US. However, because of the limitations of the data collected the scope of these attributes were narrowed considerably to just broadband and population levels.Preprocessing/Pre-Mining
In order to merge the two city location data sets and use them as a part of the FCC Broadband test API some preprocessing of the data was necessary. As stated earlier I had to union the list of 25,000 coordinate rich locations with the list of 80,000 population locations to get a list of locations to put through the FCC API. Doing so in in python, yielded only a couple thousand matches between the two lists. This appeared suspicious so upon closer inspection it became evident that there was no consistant usage of city/town terminology between the two lists. This meant that although in one list there exists a Hampton Town, GA in the other there was only a Hampton City, GA. So in order to accomodate for this inonsistency I removed all location related terminology such as town and city from both lists. From here I generated the equivalent of a left (longitude/latitude list) outer join of these sets to make a list of about 25,000 locations of which about 20,000 had matches with the population data. From here I proceeded to feed the locations into the API to generate a list of the broadband data using the following python implementation.
 import xml.dom.minidom
import urllib2
import re,sys,time,random

def grabData(lat,long):
	url='http://data.fcc.gov/api/speedtest/find?latitude=%s&longitude=%s' % (lat,long)
	try:
		doc=xml.dom.minidom.parseString(urllib2.urlopen(url).read())
		wirelineMaxDownload=doc.getElementsByTagName('wirelineMaxDownload')[0].firstChild.data
		wirelineMaxUpload=doc.getElementsByTagName('wirelineMaxUpload')[0].firstChild.data
		wirelineAvgDownload=doc.getElementsByTagName('wirelineAvgDownload')[0].firstChild.data
		wirelineAvgUpload=doc.getElementsByTagName('wirelineAvgUpload')[0].firstChild.data
		wirelessMaxDownload=doc.getElementsByTagName('wirelessMaxDownload')[0].firstChild.data
		wirelessMaxUpload=doc.getElementsByTagName('wirelessMaxUpload')[0].firstChild.data
		wirelessAvgDownload=doc.getElementsByTagName('wirelessAvgDownload')[0].firstChild.data
		wirelessAvgUpload=doc.getElementsByTagName('wirelessAvgUpload')[0].firstChild.data
		wirelineTests=doc.getElementsByTagName('wirelineTests')[0].firstChild.data
		wirelessTests=doc.getElementsByTagName('wirelessTests')[0].firstChild.data
	except urllib2.HTTPError, urllib2.URLError:
		print "Unknown FCC BroadBand Test"
		wirelineMaxDownload='unknown'
		wirelineMaxUpload='unknown'
		wirelineAvgDownload='unknown'
		wirelineAvgUpload='unknown'
		wirelessMaxDownload='unknown'
		wirelessMaxUpload='unknown'
		wirelessAvgDownload='unknown'
		wirelessAvgUpload='unknown'
		wirelineTests='unknown'
		wirelessTests='unknown'
	output=wirelineMaxDownload+','+wirelineMaxUpload+','+wirelineAvgDownload+','
	output+=wirelineAvgUpload+','+wirelessMaxDownload+','+wirelessMaxUpload+','
	output+=wirelessAvgDownload+','+wirelessAvgUpload+','+wirelineTests+','+wirelessTests+","+lat+','+long
	return ','+output+'\n'


def grabCo(city,state):
	url='http://brainoff.com/geocoder/rest?city=%s,%s,US' % (city.replace(' ','+'),state)

	try:
		doc=xml.dom.minidom.parseString(urllib2.urlopen(url).read())
		longitude=doc.getElementsByTagName('geo:long')[0].firstChild.data
		latitude=doc.getElementsByTagName('geo:lat')[0].firstChild.data
		return latitude,longitude
	except urllib2.HTTPError:
		return -9999,-9999

	except urllib2.URLError:
		return -9999,-9999

	except IndexError:
		return -9999,-9999


statesF=open('states2.txt','r')

states={}

# Read in state to abbreviation dictionary
for line in statesF:
	m=line.split(',')
	states[m[0]]=m[1].rstrip()

f=open(sys.argv[1],"r")
w=open("TrialData.csv","a")
fail=open("FailLog.txt",'a')
count=0

f.readline()

for line in f:
	count=count+1
	time.sleep(random.uniform(.4,1))
	try:
		m=line.split(',')
		if(m[0]==m[1]):
			print "State: "+m[0]+" "+m[1]
			continue
		latitude,longitude=grabCo(m[0],states[m[1]])
		if(latitude==-9999):
			print "LATITUDE LONGITUDE FAILURE " + str(count) + " "+m[0]+" "+m[1]
			fail.write(str(count) +','+line)
			continue


		line=line[:-1]+grabData(latitude,longitude)
		print m[0] + " " + m[1];
		w.write(line)
	except KeyboardInterrupt:
		f.close()
		w.close()
		fail.close()

	if count%100==0:
		time.sleep(3)
		fail.close()
		fail=open("FailLog.csv",'a')
		w.close()
		w=open("TrialData.csv","a")
print "finished"
f.close()
w.close()
Exploration
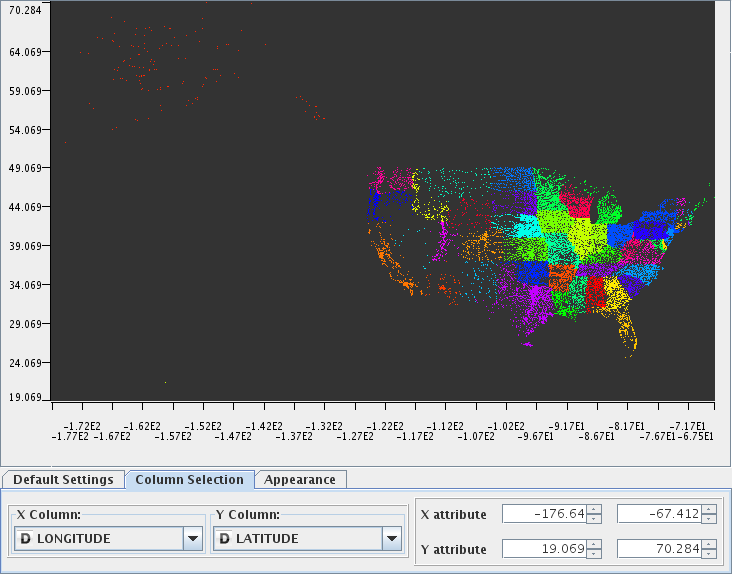
The first thing that I wanted to do was to visualize various subsets of the data exploiting KNIME's scatter plot and the fact that the data contained latitude and longtitude coordinates. The first of which is the plot of all 25,000 data points colored by state.

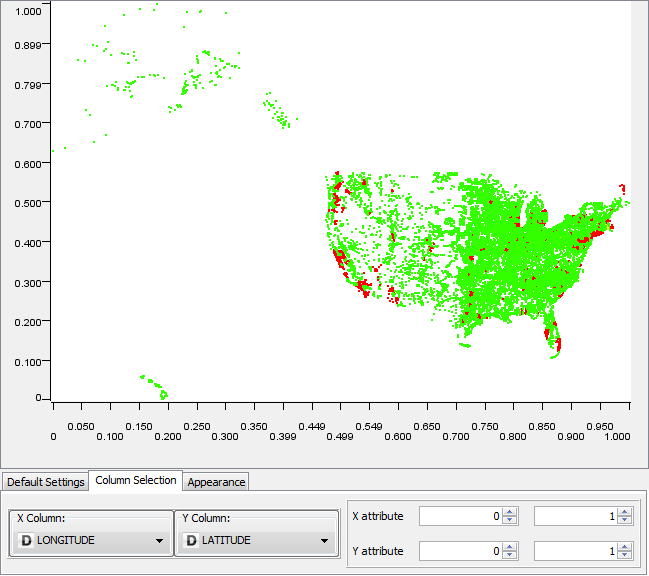
Then a plot of data that had no missing values.

Then a plot of all the records with mssing values.

Then a plot of all records with known population values

And lastly a plot of records with known broadband test values

From there I created a correlation matrix to help drive some of the investigation from this point on.

The first thing that was observed from this matrix was the fact that there is only a small positive correlation between population and any of the other broadband data. Upon further investigation a flaw in my perception of the broadband data presented itself. I had assumed that the resolution of the FCC data was close to a city level, but in fact it appears that cities within relatively close proximities have the same broadband values returned. This mean't that cities with large populations and cities with relatively smaller population would yield the same broadband data meaning that the actual resolution that the FCC site uses is closer to the level of counties. This meant that any of the average broadband values from the API cannot actually be used to see if there is any relation with population. That said, it was still possible to use the maximum speeds returned from each "county" and try to check against the cities with the largest/smallest populations. Although it isn't possible to conclusively claim that the high internet speeds came from larger cities, it turned out that it didn't really matter as population seemed to have little baring on the speed results. The largest populations from the counties with the fastest download speeds were close to one hundred thousand, which is no where near the the levels of the largest or smallest populations recorded. That said there does seem to be some correlation between population and broadband levels and population as shown below.


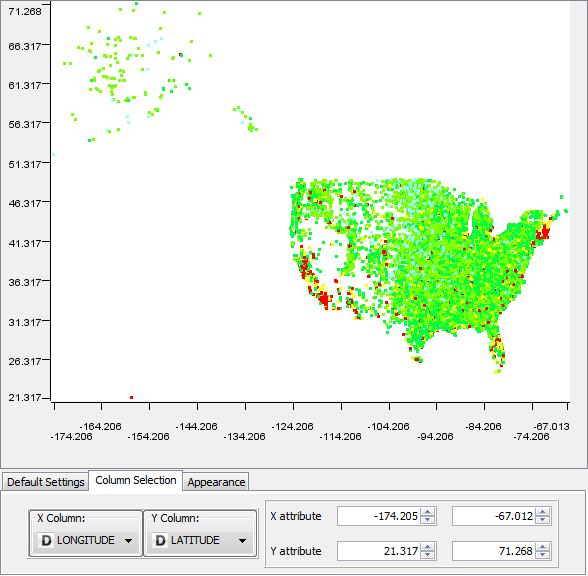
The top graph is a graph of the k-means clustering of the FCC data with n=3. This clustering divided the records into three groups of low, medium, and high values. For the most part, if any one attribute had high values then the rest followed suite. If a location has a high download speed then it seemed likely that it will also have a high average download speed, high upload speeds, etc. The bottom map is a plot of population where red locations are cities with populations greater than 40,000 and yellow locations are cities with populations greater than 10,000. Although the graphs are not completly identical there are a lot of identical features between the two.
Complications
Some complications that faced this project include the following. First, in the initial portion of collecting data, before I found the list of 25,000 coordinates, I looked for a free geocoding website that would let me work in the tens of thousands of locations in a relatively short amount of time. This took a fair amount of time and even with the suggestion of a service by one of the text's for the course nothing viable was found. Another source of problems that occured often during this project when compared to the last are memory errors and java heap errors. The data set used in the last project was about 1/10 of the current data set so hardware limitations of my machine caused mining algorithms to error out or KNIME to hang and crash often.
Conclusion
Although there was no conclusive link between population and broadband speeds due to a broader resolution of the FCC data then was originally thought, there does seem to be some correlation between the two. Also, the somewhat obvious conclusion that high performance on one attribute of broadband information meant higher performance on the other attributes was also supported.